QQE Super Trend Forex Trading Strategy

Simple is good when it works! Many new traders first start discovering simple strategies. They learn something, see how it works and are amazed by it. They would start to believe it is the Holy Grail of trading. Many would experience inconsistent successes and failures. A streak of wins and losses every now and then. Then, they look for ways to improve their strategies. The same thing happens. They get pumped up only to find its inconsistencies. So, they repeat the process of discovering and learning.

Just as toddlers are like sponges learning every new word they hear, new traders are also very adept to learning something new. Although this should be a good thing, however, there are many cases wherein this could go out of hand. They would learn something new and incorporate it in their trading until their trading charts become a mess. Before they know it, they have a chart with 10 different indicators and 20 different rules. They have just simply overcomplicated their trading process. Still, many find themselves trading with inconsistent profits and losses.

There is no need to overcomplicate trading. Sometimes all we need are just a few technical indicators that work well when used together. Finding confluences that work synergistically could significantly improve the probabilities of your trade setup. QQE Super Trend is a trading strategy that works well because it is based on two high probability technical indicators. Individually, these indicators already produce great results. Combining these two complementary indicators further improves the strategy allowing traders to profit from the forex markets.

Qualitative Quantitative Estimation

Qualitative Quantitative Estimation, more popularly known as QQE, is a trend-following technical indicator. It is used primarily to help traders identify trend reversals both on the mid- and long-term, as well as the short-term momentum.

The QQE is displayed as an oscillating indicator. The usual versions of the QQE would display two lines oscillating around the midline which is at zero. One line would be solid, and another would be a dashed line. The solid line represents the QQE line, while the dashed line represents its signal line.

There are several ways to use the QQE indicator. First, traders could identify the bigger picture trend bias by looking at whether the QQE lines are positive or negative. This could either be a trade direction filter or a trade signal. Another approach would be to trade based on the crossing over of the two lines. This approach works as a momentum or short-term trend reversal signal. Lastly, mean reversal traders trade based on crossovers wherein the two lines are reversing back to the midline. Some would exit as the lines cross zero, while others ride the reversal until the two lines crossover indicating another reversal.

The QQE indicator is one of the few indicators that work well as a standalone indicator. Some traders even consider it as their “Holy Grail”. Still, it is best to use the QQE as part of a bigger picture trading strategy.

Super Trend Indicator

The Super Trend indicator is a trend-following technical indicator derived from the Average True Range (ATR).

Many traders use the ATR to identify trends and trend reversals. The most widely accepted idea behind the ATR and trend is that if price reverses by more than three times the current ATR, then the trend is reversing.

The Super Trend indicator is based around this concept. It detects the current trend direction. It then plots a line opposite the current trend direction. The line is plotted with a distance three times the current ATR. If price breaches the line, the line shifts indicating that the trend has reversed.

The Super Trend indicator could be used as a trend reversal signal, a trend direction trade filter, or as a stop loss placement. As a trend reversal signal, traders could take a trade based on the shifting of the Super Trend line. As a trend direction filter, traders could use it as a basis to filter out low probability trade setups based on the direction of the trend. As a stop loss placement, traders could trail their stop loss a behind the Super Trend line until stopped out.

Trading Strategy

This trading strategy is a simple trading strategy that uses two high probability trend-following technical indicators, namely the QQE and the Super Trend indicators.

First, we would have to filter trades based on the bigger picture trend. To do this, we would be using the 100-period Exponential Moving Average (EMA). Trend direction will be mainly based on the slope of the 100 EMA line. Price could retrace and touch the 100 EMA line but should show signs of rejection on the area of the line.

Then, we filter the trend based on the Super Trend indicator. This will be based on the color of the line as well as the location of the line. The trend indication of the Super Trend indicator should align with the 100 EMA line.

Lastly, on the QQE indicator, we would be disregarding the dashed line. For this reason, we have preset the indicator not to show the dashed line. Instead, we will be using the crossing of the solid blue line over zero as a trend reversal indication. This will be our main signal. However, confluences with the trend reversal of the Super Trend indicator would also be a good signal.

Indicators:

  • 100 EMA (Green line)
  • SuperTrend (default setting)
  • QQE (default setting)

Preferred Time Frames: 30-minute, 1-hour and 4-hour charts

Currency Pairs: major and minor pairs

Trading Sessions: Tokyo, London and New York sessions
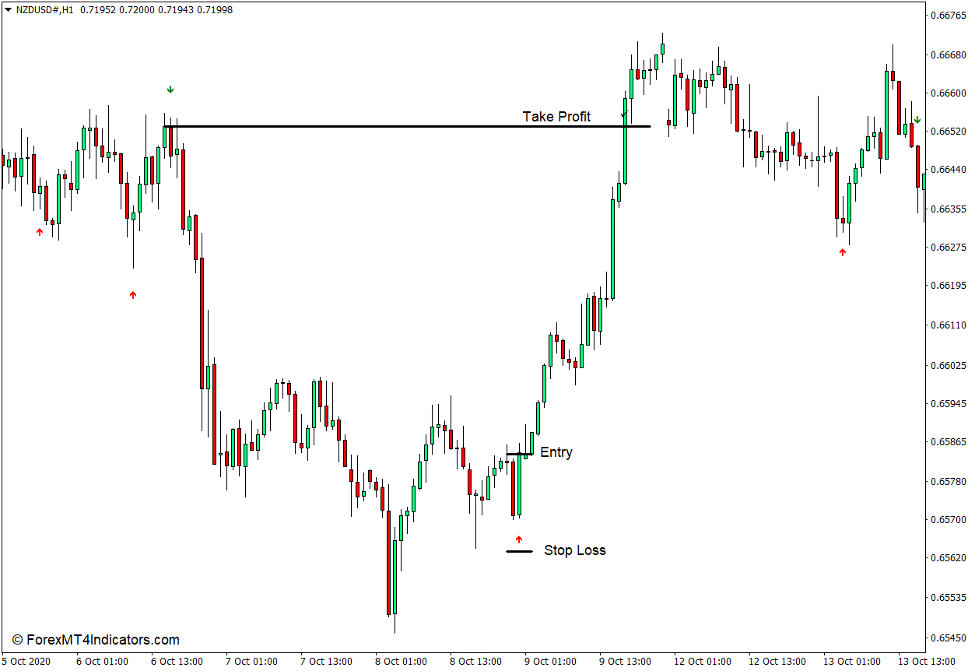
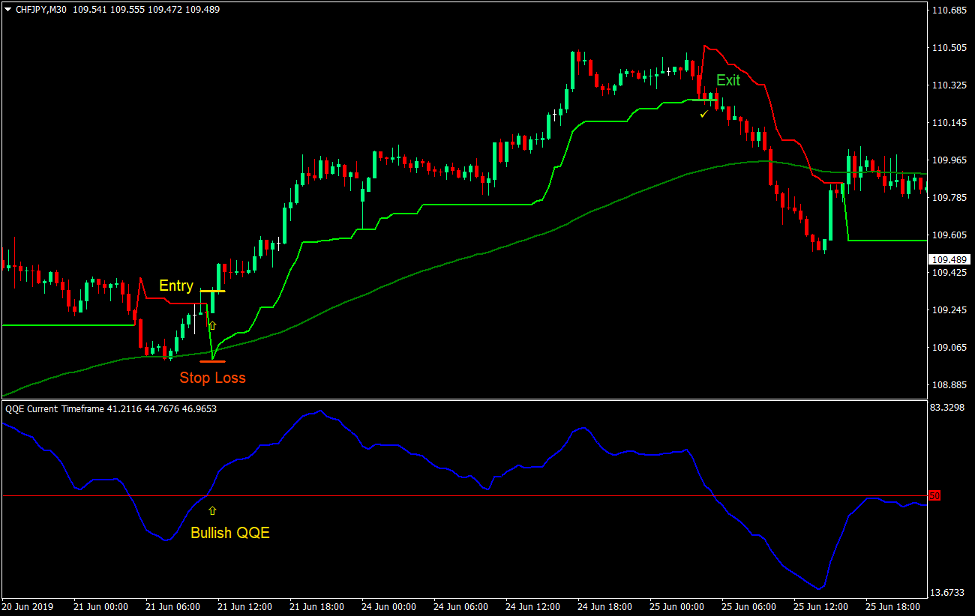
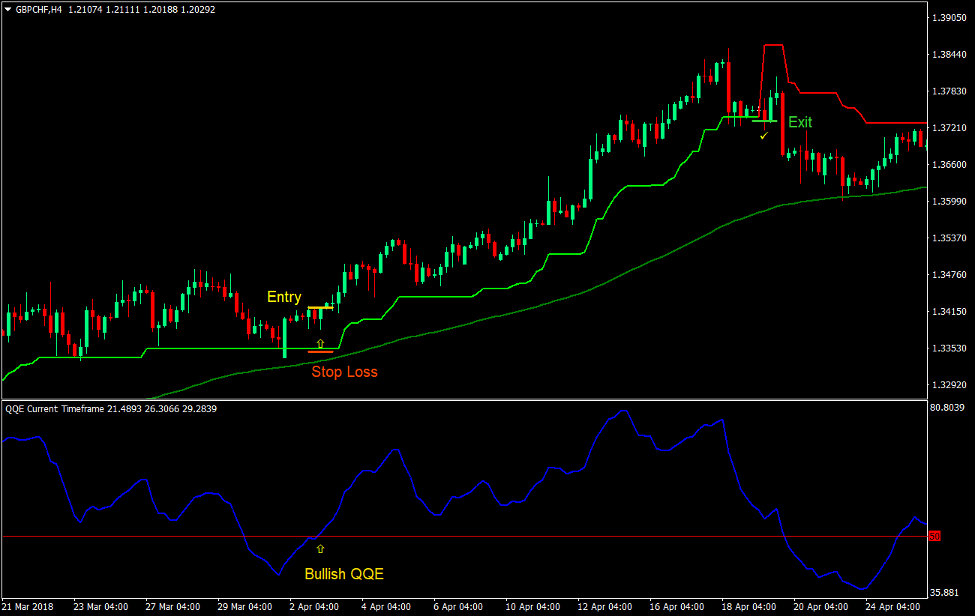
Buy Trade Setup

Entry

  • The 100 EMA line should be sloping up.
  • Price should be above the 100 EMA line.
  • The Super Trend indicator should plot a lime line below price.
  • The solid blue line of the QQE indicator should cross above zero.
  • Enter a buy order on the confirmation of the conditions above.

Stop Loss

  • Set the stop loss below the Super Trend line.

Exit

  • Close the trade as soon as the Super Trend line shifts above price and changes to red.
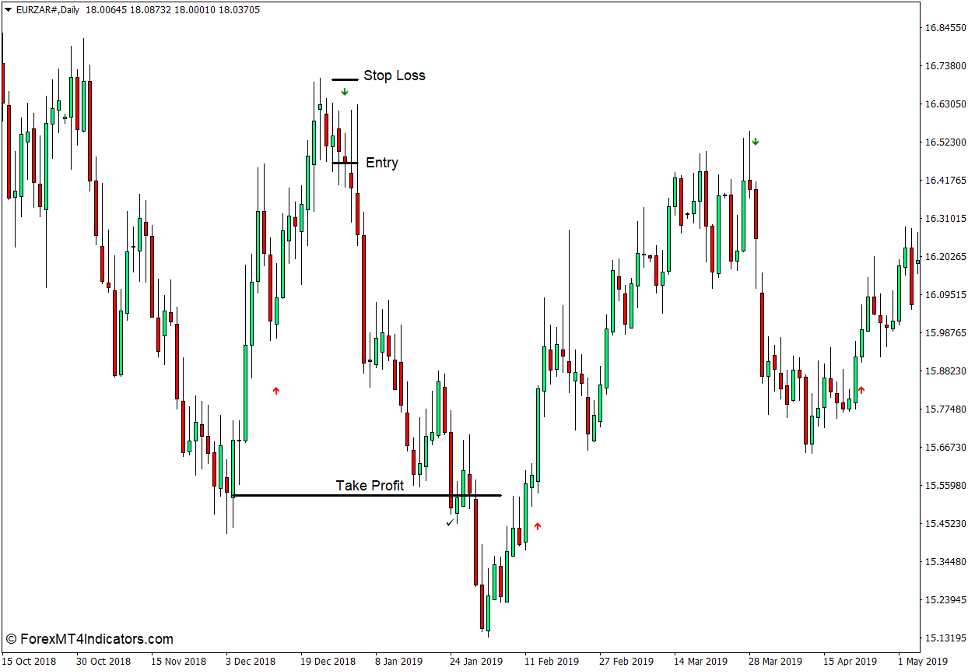
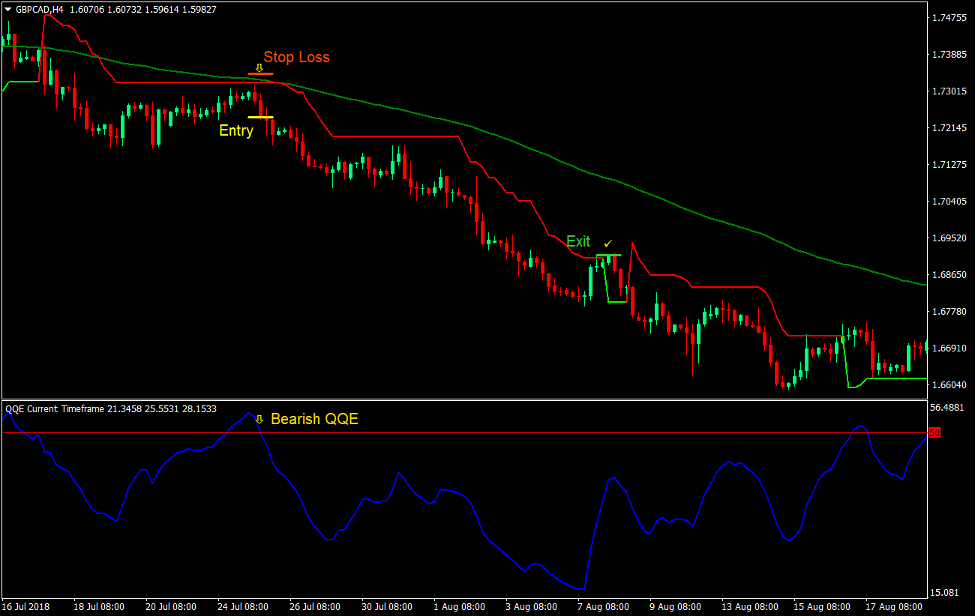
QQE Super Trend Forex Trading Strategy

QQE Super Trend Forex Trading Strategy 2

Sell Trade Setup

Entry

  • The 100 EMA line should be sloping down.
  • Price should be below the 100 EMA line.
  • The Super Trend indicator should plot a red line above price.
  • The solid blue line of the QQE indicator should cross below zero.
  • Enter a sell order on the confirmation of the conditions above.

Stop Loss

  • Set the stop loss above the Super Trend line.

Exit

  • Close the trade as soon as the Super Trend line shifts below price and changes to lime.

QQE Super Trend Forex Trading Strategy 4

Conclusion

This trading strategy could work well if used in a market that is trending. Signals are typically generated whenever price retraces towards the 100 EMA line.

It is also best to use this strategy in conjunction with price action. Candles that are showing signs of price rejection on the area of the 100 EMA line are good signals indicating that price is about to resume its trend.


Forex Trading Strategies Installation Instructions

QQE Super Trend Forex Trading Strategy is a combination of Metatrader 4 (MT4) indicator(s) and template.

The essence of this forex strategy is to transform the accumulated history data and trading signals.

QQE Super Trend Forex Trading Strategy provides an opportunity to detect various peculiarities and patterns in price dynamics which are invisible to the naked eye.

Based on this information, traders can assume further price movement and adjust this strategy accordingly.

Recommended Forex Metatrader 4 Trading Platform

  • Free $50 To Start Trading Instantly
  • Deposit Bonus up to $5,000
  • Unlimited Loyalty Program
  • Awards Winning Trading Broker

xm account

Click Here for Step By Step XM Trading Account Opening Guide

How to install QQE Super Trend Forex Trading Strategy?

  • Download QQE Super Trend Forex Trading Strategy.zip
  • *Copy mq4 and ex4 files to your Metatrader Directory / experts / indicators /
  • Copy tpl file (Template) to your Metatrader Directory / templates /
  • Start or restart your Metatrader Client
  • Select Chart and Timeframe where you want to test your forex strategy
  • Right click on your trading chart and hover on “Template”
  • Move right to select QQE Super Trend Forex Trading Strategy
  • You will see QQE Super Trend Forex Trading Strategy is available on your Chart

*Note: Not all forex strategies come with mq4/ex4 files. Some templates are already integrated with the MT4 Indicators from the MetaTrader Platform.

Click here below to download:

Save

Save

Get Download Access

La entrada QQE Super Trend Forex Trading Strategy se publicó primero en ForexMT4Indicators.com.

QQE Super Trend Forex Trading Strategy published first on https://alphaex-capital.blogspot.com/

3 Moving Average Cross with Alert Indicator for MT4

Introduction to the 3 Moving Average Cross with Alert Indicator

One of the ways traders objectively identify a trend reversal is with the use of moving average crossovers. Traders would identify a bullish trend reversal whenever a fast moving average line crosses above a slow moving average line. Inversely, they also identify bearish trend reversals whenever the moving average lines crossover moving down. This indicator simplifies this process by plotting an arrow whenever its underlying moving averages crossover.

What is the 3 Moving Average Cross with Alert Indicator?

The 3 Moving Average Cross with Alert Indicator is a trend following indicator which also acts as a trend reversal signal indicator. It identifies trend reversals using moving average lines as a basis for identifying trends and plots an arrow pointing the direction of the trend reversal. It plots red arrows pointing up to indicate a bullish trend reversal, and green arrows pointing down to indicate a bearish trend reversal.

3 Moving Average Cross with Alert Indicator for MT4

How the 3 Moving Average Cross with Alert Indicator Works?

The 3 Moving Average Cross with Alert Indicator uses the crossing over of three underlying moving average lines as a basis for identifying trend reversals.

It detects whenever the faster moving average lines has crossed above the slower moving average lines wherein the fastest moving average line is at the top and slowest moving average line is at the bottom. It then plots an arrow pointing up whenever this sequence is detected.

Inversely, it also detects whenever the moving average lines crossover wherein the fastest moving average line is as the bottom and the slowest is at the top. It then plots an arrow pointing down as this develops.

How to use the 3 Moving Average Cross with Alert Indicator for MT4

This indicator has several variables which adjusts the underlying moving average lines thereby modifying the sensitivity of the indicator.

“FasterMA”, “MediumMA”, and “SlowerMA” refers to the number of bars used by the moving average lines.

“FasterShift”, “MediumShift”, and “SlowerShift” shifts the underlying moving average lines forward or back.

“FasterMode”, “MediumMode”, and SlowerMode” allows users to choose which type of underlying moving average is used.

“Sound Alert” toggles the alert on or off as the moving average lines crossover.

How the 3 Moving Average Cross with Alert Indicator Works

This indicator can be used as a trend reversal signal indicator using the arrows as a basis for the reversal signals. However, this indicator is best used in confluence with other technical analysis indications. Since moving average crossovers do tend to have lag, traders can also set a take profit target in order to exit their trades earlier with higher profits.

Buy Trade Setup

When to Enter?

Open a buy order as soon as an arrow pointing up is formed. Set the stop loss on the support below the entry candle.

When to Exit?

Set a take profit target on a logical resistance level or close the trade as an arrow pointing down forms.

How to use the 3 Moving Average Cross with Alert Indicator for MT4 - Buy Trade

Sell Trade Setup

When to Enter?

Open a sell order as soon as an arrow pointing down is formed. Set the stop loss on the resistance above the entry candle.

When to Exit?

Set a take profit target on a logical support level or close the trade as an arrow pointing up forms.

How to use the 3 Moving Average Cross with Alert Indicator for MT4 - Sell Trade

Conclusion

Moving average crossovers can be a good option for identifying trend reversals and used as an entry signal. This indicator is an excellent tool for this purpose. However, it is up to the user to modify the underlying moving average lines in order to arrive at the right combination of moving averages.

MT4 Indicators – Download Instructions

3 Moving Average Cross with Alert Indicator for MT4 is a Metatrader 4 (MT4) indicator and the essence of this technical indicator is to transform the accumulated history data.

3 Moving Average Cross with Alert Indicator for MT4 provides for an opportunity to detect various peculiarities and patterns in price dynamics which are invisible to the naked eye.

Based on this information, traders can assume further price movement and adjust their strategy accordingly. Click here for MT4 Strategies

Recommended Forex Metatrader 4 Trading Platform

  • Free $50 To Start Trading Instantly
  • Deposit Bonus up to $5,000
  • Unlimited Loyalty Program
  • Awards Winning Trading Broker

xm account

Click Here for Step By Step XM Trading Account Opening Guide

How to install 3 Moving Average Cross with Alert Indicator for MT4.mq4?

  • Download 3 Moving Average Cross with Alert Indicator for MT4.mq4
  • Copy 3 Moving Average Cross with Alert Indicator for MT4.mq4 to your Metatrader Directory / experts / indicators /
  • Start or restart your Metatrader 4 Client
  • Select Chart and Timeframe where you want to test your MT4 indicators
  • Search “Custom Indicators” in your Navigator mostly left in your Metatrader 4 Client
  • Right click on 3 Moving Average Cross with Alert Indicator for MT4.mq4
  • Attach to a chart
  • Modify settings or press ok
  • Indicator 3 Moving Average Cross with Alert Indicator for MT4.mq4 is available on your Chart

How to remove 3 Moving Average Cross with Alert Indicator for MT4.mq4 from your Metatrader Chart?

  • Select the Chart where is the Indicator running in your Metatrader 4 Client
  • Right click into the Chart
  • “Indicators list”
  • Select the Indicator and delete

3 Moving Average Cross with Alert Indicator for MT4 (Free Download)

Click here below to download:

Download Now

La entrada 3 Moving Average Cross with Alert Indicator for MT4 se publicó primero en ForexMT4Indicators.com.

3 Moving Average Cross with Alert Indicator for MT4 published first on https://alphaex-capital.blogspot.com/

X2MA 2HTF MT5 Indicator

Two X2MA moving averages from different timeframes, drawn in a single window as a color cloud colored according to the trend direction.

MT5 Indicators – Download Instructions

X2MA 2HTF MT5 Indicator is a Metatrader 5 (MT5) indicator and the essence of this technical indicator is to transform the accumulated history data.

X2MA 2HTF MT5 Indicator provides for an opportunity to detect various peculiarities and patterns in price dynamics which are invisible to the naked eye.

Based on this information, traders can assume further price movement and adjust their strategy accordingly. Click here for MT5 Strategies

Recommended Forex Metatrader 5 Trading Platform

  • Free $50 To Start Trading Instantly
  • Deposit Bonus up to $5,000
  • Unlimited Loyalty Program
  • Awards Winning Trading Broker

xm account

Click Here for Step By Step XM Trading Account Opening Guide

How to install X2MA 2HTF MT5 Indicator.mq5 to your MetaTrader 5 Chart?

  • Download X2MA 2HTF MT5 Indicator.mq5
  • Copy X2MA 2HTF MT5 Indicator.mq5 to your Metatrader 5 Directory / experts / indicators /
  • Start or restart your Metatrader 5 Client
  • Select Chart and Timeframe where you want to test your mt5 indicator
  • Search “Custom Indicators” in your Navigator mostly left in your Metatrader 5 Client
  • Right click on X2MA 2HTF MT5 Indicator.mq5
  • Attach to a chart
  • Modify settings or press ok
  • Indicator X2MA 2HTF MT5 Indicator.mq4 is available on your Chart

How to remove X2MA 2HTF MT5 Indicator.mq5 from your Metatrader 5 Chart?

  • Select the Chart where is the Indicator running in your Metatrader 5 Client
  • Right click into the Chart
  • “Indicators list”
  • Select the Indicator and delete

X2MA 2HTF MT5 Indicator (Free Download)

Click here below to download:

Download Now

La entrada X2MA 2HTF MT5 Indicator se publicó primero en ForexMT4Indicators.com.

X2MA 2HTF MT5 Indicator published first on https://alphaex-capital.blogspot.com/

USDINDEX: Wild end of the month

The USDIndex closed the week sharply higher by +0.83%. The US Dollar found support from the recent acceleration of market expectations for a Fed rate hike by the end of 2022. Last summer, the market did not expect the Fed’s first rate hike until early 2023. However, now the market is fully expecting 2 rate hikes of +25 bps at the end of 2022. That’s even more than the +20 bp rate hike forecast from the ECB. The USDIndex closed October with a negligible total decline of -0.21%. This indicates that the economic recovery in the US is still much better compared to other countries.

Remaining supply chain problems, rising prices and still strong consumer demand continue. Growth in new home sales, the first rise in consumer confidence in three months and personal spending data are on a positive note, although the third quarter GDP growth was only 2.0%, due to the increasing trade deficit. Goods spending fell 9.2% in the third quarter as the PCE deflator rose to 4.4% y/y, the highest level in more than 30 years. This further strengthens the prospect of a rate hike sooner rather than later. This week’s slate include heavy data that the market is paying attention to including ISM Manufacturing, ISM Services, ADP, FOMC Statement on Interest Rates and Non-Farm Payrolls.

USDIndex, D1

The USDIndex scored a fresh weekly high at 94.29 and closed the weekend at 94.10. Friday’s price move printed a Marubozu candle that completely covered the previous 11 trading days, with a significantly strong upside bias for the USD. The bullish support for USDIndex is seen from the 50-day moving average which remains below the price and the uptrend line acting as the dominant support diagonally. While the RSI is currently settling at 56.22 after the maneuver, overall the above confirms a bullish bias.

However the rally is still limited by the resistance at 94.54. A break of this price level will confirm the continuation of the second leg’s rebound of 89.49 to the 50.0% retracement target. On the downside, a failure at 94.54 will open the door for a retest of the 93.24 support area and a break of this level will target 91.91.

Click here to access our Economic Calendar

Ady Phangestu

Market Analyst – HF Educational office – Indonesia

Disclaimer: This material is provided as a general marketing communication for information purposes only and does not constitute an independent investment research. Nothing in this communication contains, or should be considered as containing, an investment advice or an investment recommendation or a solicitation for the purpose of buying or selling of any financial instrument. All information provided is gathered from reputable sources and any information containing an indication of past performance is not a guarantee or reliable indicator of future performance. Users acknowledge that any investment in Leveraged Products is characterized by a certain degree of uncertainty and that any investment of this nature involves a high level of risk for which the users are solely responsible and liable. We assume no liability for any loss arising from any investment made based on the information provided in this communication. This communication must not be reproduced or further distributed without our prior written permission.

USDINDEX: Wild end of the month published first on https://alphaex-capital.blogspot.com/

RSI Custom Smoothing MT5 Indicator

The following settings are now available as input parameters:

  • color of the indicator main line
  • width of the indicator main line
  • values of the two indicator levels

MT5 Indicators – Download Instructions

RSI Custom Smoothing MT5 Indicator is a Metatrader 5 (MT5) indicator and the essence of this technical indicator is to transform the accumulated history data.

RSI Custom Smoothing MT5 Indicator provides for an opportunity to detect various peculiarities and patterns in price dynamics which are invisible to the naked eye.

Based on this information, traders can assume further price movement and adjust their strategy accordingly. Click here for MT5 Strategies

Recommended Forex Metatrader 5 Trading Platform

  • Free $50 To Start Trading Instantly
  • Deposit Bonus up to $5,000
  • Unlimited Loyalty Program
  • Awards Winning Trading Broker

xm account

Click Here for Step By Step XM Trading Account Opening Guide

How to install RSI Custom Smoothing MT5 Indicator.mq5 to your MetaTrader 5 Chart?

  • Download RSI Custom Smoothing MT5 Indicator.mq5
  • Copy RSI Custom Smoothing MT5 Indicator.mq5 to your Metatrader 5 Directory / experts / indicators /
  • Start or restart your Metatrader 5 Client
  • Select Chart and Timeframe where you want to test your mt5 indicator
  • Search “Custom Indicators” in your Navigator mostly left in your Metatrader 5 Client
  • Right click on RSI Custom Smoothing MT5 Indicator.mq5
  • Attach to a chart
  • Modify settings or press ok
  • Indicator RSI Custom Smoothing MT5 Indicator.mq4 is available on your Chart

How to remove RSI Custom Smoothing MT5 Indicator.mq5 from your Metatrader 5 Chart?

  • Select the Chart where is the Indicator running in your Metatrader 5 Client
  • Right click into the Chart
  • “Indicators list”
  • Select the Indicator and delete

RSI Custom Smoothing MT5 Indicator (Free Download)

Click here below to download:

Download Now

La entrada RSI Custom Smoothing MT5 Indicator se publicó primero en ForexMT4Indicators.com.

RSI Custom Smoothing MT5 Indicator published first on https://alphaex-capital.blogspot.com/

Events to Look Out for Next Week

  • Caixin Manufacturing PMI (CNY, GMT 12:45) – The key data point from China follows the non-manufacturing number which is due on Sunday before the market open. The manufacturing number is expected to hold steady at the key 50.00 pivot point with the non-manufacturing number slipping slightly to 52.9 from 53.2.
  • ISM Manufacturing PMI (USD, GMT 13:00) – The key ISM manufacturing number printed at 4-mth high in October at 61.1 and is expected to register a slip to a still healthy 60.4, still well below the 2021 high in April of 64.7
  • Monetary Policy Meeting Minutes (JPY, GMT 23:50) – confirmation likely of the BOJ’s continued accommodative policy, improved outlook and inflation expectations.

Tuesday – 02 November2021


  • Interest Rate Decision, Statement and Conference (AUD, GMT 14:00) – Australian short-term yields have rocketed this week after stronger than expected retail sales and speculation that the RBA will officially drop its yield target during this meeting and amend its forward guidance. Westpac this week confirmed their expectation for a rate hike in Q1 2023, while current RBA guidance still talks of 2024.
  • Unemployment rate & Employment Change (NZD, GMT 21:45) The Q3  unemployment rate is expected to move higher to 4.5% from 4.0% with the Employment change slipping to +0.7% from 1.0%, whilst the participation rate remains steady at 70.6%.

Wednesday – 03 November 021


  • ADP Employment change (USD, GMT 11:15) – The private payrolls report is expected to show a  significant drop to 369,000 from 568,000 in October. Although the link to the NFP data is clearly now broken many traders will still be focused on the size of the decline in private payrolls.
  • ISM Services PMI  (USD, GMT 13:00) – A decline from Octobers spike to 61.9 is expected with the data slipping 0.4 to a still healthy 61.5. The cycle high was the August 64.1 up from the March low at 55.3.
  • Interest Rate Decision, Statement and Conference (USD, GMT 17:00)–The market expects the Fed to announce the widely anticipated taper, ($10-20bln, with expectations focused on $15bln) which should extend into the middle of 2022, though no signals are expected regarding the timing of an eventual rate hike cycle, which the market now assumes will be seen in 2022 and not 2023. Chair Powell’s press conference will follow 30-minutes after the announcement.

Thursday – 04 November2021


  • OPEC-JMMC Meetings (USD, GMT All-day) – With Crude Oil prices continuing to track higher and the Energy crisis in Europe showing some signs of easing all eyes will be on the latest OPEC pronouncements. The 400k barrels per day increase for November was part of the organizations continued “gradual” increases agreed back in July. This is likely to remain in place, despite some pressure from within for greater production increases.
  • Interest Rate Decision, MPC & Report & Votes & APF Report (GBP, GMT 11:00 & 11:30)  –  Markets have factored in prevailing BoE tightening expectations, which has led to the Pound losing upside momentum this week. Market participants will also be cognisant of higher interest rates at a time when the UK economic recovery is experiencing pronounced delivery/supply chain issues alongside near record energy prices. The consensus is for the BoE to hike its repo rate by 15bp to 0.25% in Q1 2022, although there seems to be an outside risk of such a move coming as soon as this meeting after the new BoE Chief Economist Pill affirmed that the meeting will be a “live” one, signalling that a move is a possibility, although unlikely. The Governor Bailey press conference will follow 30-minutes after the announcement.

Friday – 05 November 2021


  • Non-Farm Payrolls (USD, GMT 12:30) – Expectations are for a 380,000 October nonfarm payroll increase, after gains of 194,000 in September, 366,000 in August, and 1.091m in July. Expectations are for the jobless rate to hold steady at 4.8% for a second month, down from 5.2% in August. Hours-worked are assumed to rise 0.2%, after the 0.8% September increase, while the workweek ticks down to 34.7 from 34.8 in September. Average hourly earnings are assumed to rise 0.3% after gains of 0.6% in September and 0.4% in August, while the y/y wage gain should accelerate to 4.8% from 4.6%.
  • Labour Market Data (CAD, GMT 12:30) – The Canada employment change disappointed last month at 65,000 in August, missing expectations, after the 157,100 surge the previous month, following the robust surprise of 231,000 back in June. The unemployment rate is expected to hold steady this month at 6.9% continuing the decline from 9.4% at the start of the year.

Click here to access our Economic Calendar

Stuart Cowell 

Head Market Analyst

Disclaimer: This material is provided as a general marketing communication for information purposes only and does not constitute an independent investment research. Nothing in this communication contains, or should be considered as containing, an investment advice or an investment recommendation or a solicitation for the purpose of buying or selling of any financial instrument. All information provided is gathered from reputable sources and any information containing an indication of past performance is not a guarantee or reliable indicator of future performance. Users acknowledge that any investment in Leveraged Products is characterized by a certain degree of uncertainty and that any investment of this nature involves a high level of risk for which the users are solely responsible and liable. We assume no liability for any loss arising from any investment made based on the information provided in this communication. This communication must not be reproduced or further distributed without our prior written permission.

Events to Look Out for Next Week published first on https://alphaex-capital.blogspot.com/

Yesterday Today MT5 Indicator

The EA compares yesterday’s High and Low prices with the current day Close price. As soon as the current price breaks through yesterday’s High or Low, immediately open a position. If Stop Loss and Take Profit is non-zero, appropriate positions will be set for the position.

The EA opens only one position at a time, therefore it is able to work both on hedging and netting accounts.

MT5 Indicators – Download Instructions

Yesterday Today MT5 Indicator is a Metatrader 5 (MT5) indicator and the essence of this technical indicator is to transform the accumulated history data.

Yesterday Today MT5 Indicator provides for an opportunity to detect various peculiarities and patterns in price dynamics which are invisible to the naked eye.

Based on this information, traders can assume further price movement and adjust their strategy accordingly. Click here for MT5 Strategies

Recommended Forex Metatrader 5 Trading Platform

  • Free $50 To Start Trading Instantly
  • Deposit Bonus up to $5,000
  • Unlimited Loyalty Program
  • Awards Winning Trading Broker

xm account

Click Here for Step By Step XM Trading Account Opening Guide

How to install Yesterday Today MT5 Indicator.mq5 to your MetaTrader 5 Chart?

  • Download Yesterday Today MT5 Indicator.mq5
  • Copy Yesterday Today MT5 Indicator.mq5 to your Metatrader 5 Directory / experts / indicators /
  • Start or restart your Metatrader 5 Client
  • Select Chart and Timeframe where you want to test your mt5 indicator
  • Search “Custom Indicators” in your Navigator mostly left in your Metatrader 5 Client
  • Right click on Yesterday Today MT5 Indicator.mq5
  • Attach to a chart
  • Modify settings or press ok
  • Indicator Yesterday Today MT5 Indicator.mq4 is available on your Chart

How to remove Yesterday Today MT5 Indicator.mq5 from your Metatrader 5 Chart?

  • Select the Chart where is the Indicator running in your Metatrader 5 Client
  • Right click into the Chart
  • “Indicators list”
  • Select the Indicator and delete

Yesterday Today MT5 Indicator (Free Download)

Click here below to download:

Download Now


La entrada Yesterday Today MT5 Indicator se publicó primero en ForexMT4Indicators.com.

Yesterday Today MT5 Indicator published first on https://alphaex-capital.blogspot.com/

CADJPY – Central Bank meetings still can’t set a new direction

CADJPY, H4

This is another pair that enters the base adjustment mode before entering the new month. After moving up continuously since late September the Canadian Dollar was driven by oil prices and energy shortages, while the movement of the central banks of both countries this week has not yet set a new direction for this pair. At its meeting this week, the BoC kept its interest rate unchanged at 0.25%, but surprised by ending its QE program to enter a new investment phase. The country’s economic growth forecast has been revised down to 5.1% from the 6% forecast in July amid warnings of rising inflation from energy prices and continued supply chain bottlenecks.

Like the BoJ yesterday, the BoC kept its interest rate unchanged at -0.1%, but cut its GDP forecast for this year to 3.4% from the 3.8% forecast in July. It cited sluggish consumption and slowing exports due to supply chain issues.

Key economic numbers to end the week are Canada’s Q3 GDP reading, after a sharp fall in Q2 of -1.1%, below the 2.5% expected by the market and down from the 5.5% seen in the previous quarter.

From a technical point of view the pair has been in correction mode since last week, having made a nearly six-year high at 93.00. On H4, a bullish flag is seen forming with declining momentum. MACD is moving in a narrow range near the 0 line. The RSI is hovering around the 50 level with the first support at 91.70. If it breaks down there will be a next support at the week low at 91.20 and could lead to a short-term downtrend. On the contrary, if the price is able to break through the original high of 93.00 this will confirm the bullish flag pattern and the uptrend will continue.

Click here to access our Economic Calendar

Chayut Vachirathanakit
Market Analyst – HF Educational Office – Thailand

Disclaimer: This material is provided as a general marketing communication for information purposes only and does not constitute an independent investment research. Nothing in this communication contains, or should be considered as containing, an investment advice or an investment recommendation or a solicitation for the purpose of buying or selling of any financial instrument. All information provided is gathered from reputable sources and any information containing an indication of past performance is not a guarantee or reliable indicator of future performance. Users acknowledge that any investment in Leveraged Products is characterized by a certain degree of uncertainty and that any investment of this nature involves a high level of risk for which the users are solely responsible and liable. We assume no liability for any loss arising from any investment made based on the information provided in this communication. This communication must not be reproduced or further distributed without our prior written permission.

CADJPY – Central Bank meetings still can’t set a new direction published first on https://alphaex-capital.blogspot.com/

Design a site like this with WordPress.com
Get started